The debugging console, also known as the interactive window REPL (R ead/E valuate/P rint/L oop), can greatly shorten The commonly used “compilation-generation-debugging” cycle improves development efficiency. Variables, expressions, and some built-in commands for debugging exceptions can be entered in the REPL.
To open the debugging console, please use the debugging console operation at the top of the debugging view or use the View: Debug Console command, the keyboard shortcut is Ctrl+Shift+Y.
Note
You must be in a running debugging session to use the debugging console
Executing Expression
When the debugger stops at any breakpoint, you can view variables in the debug console, execute expressions
Autocompletion
When you enter code in the debugging console, IDE will automatically prompt for completion based on your input.
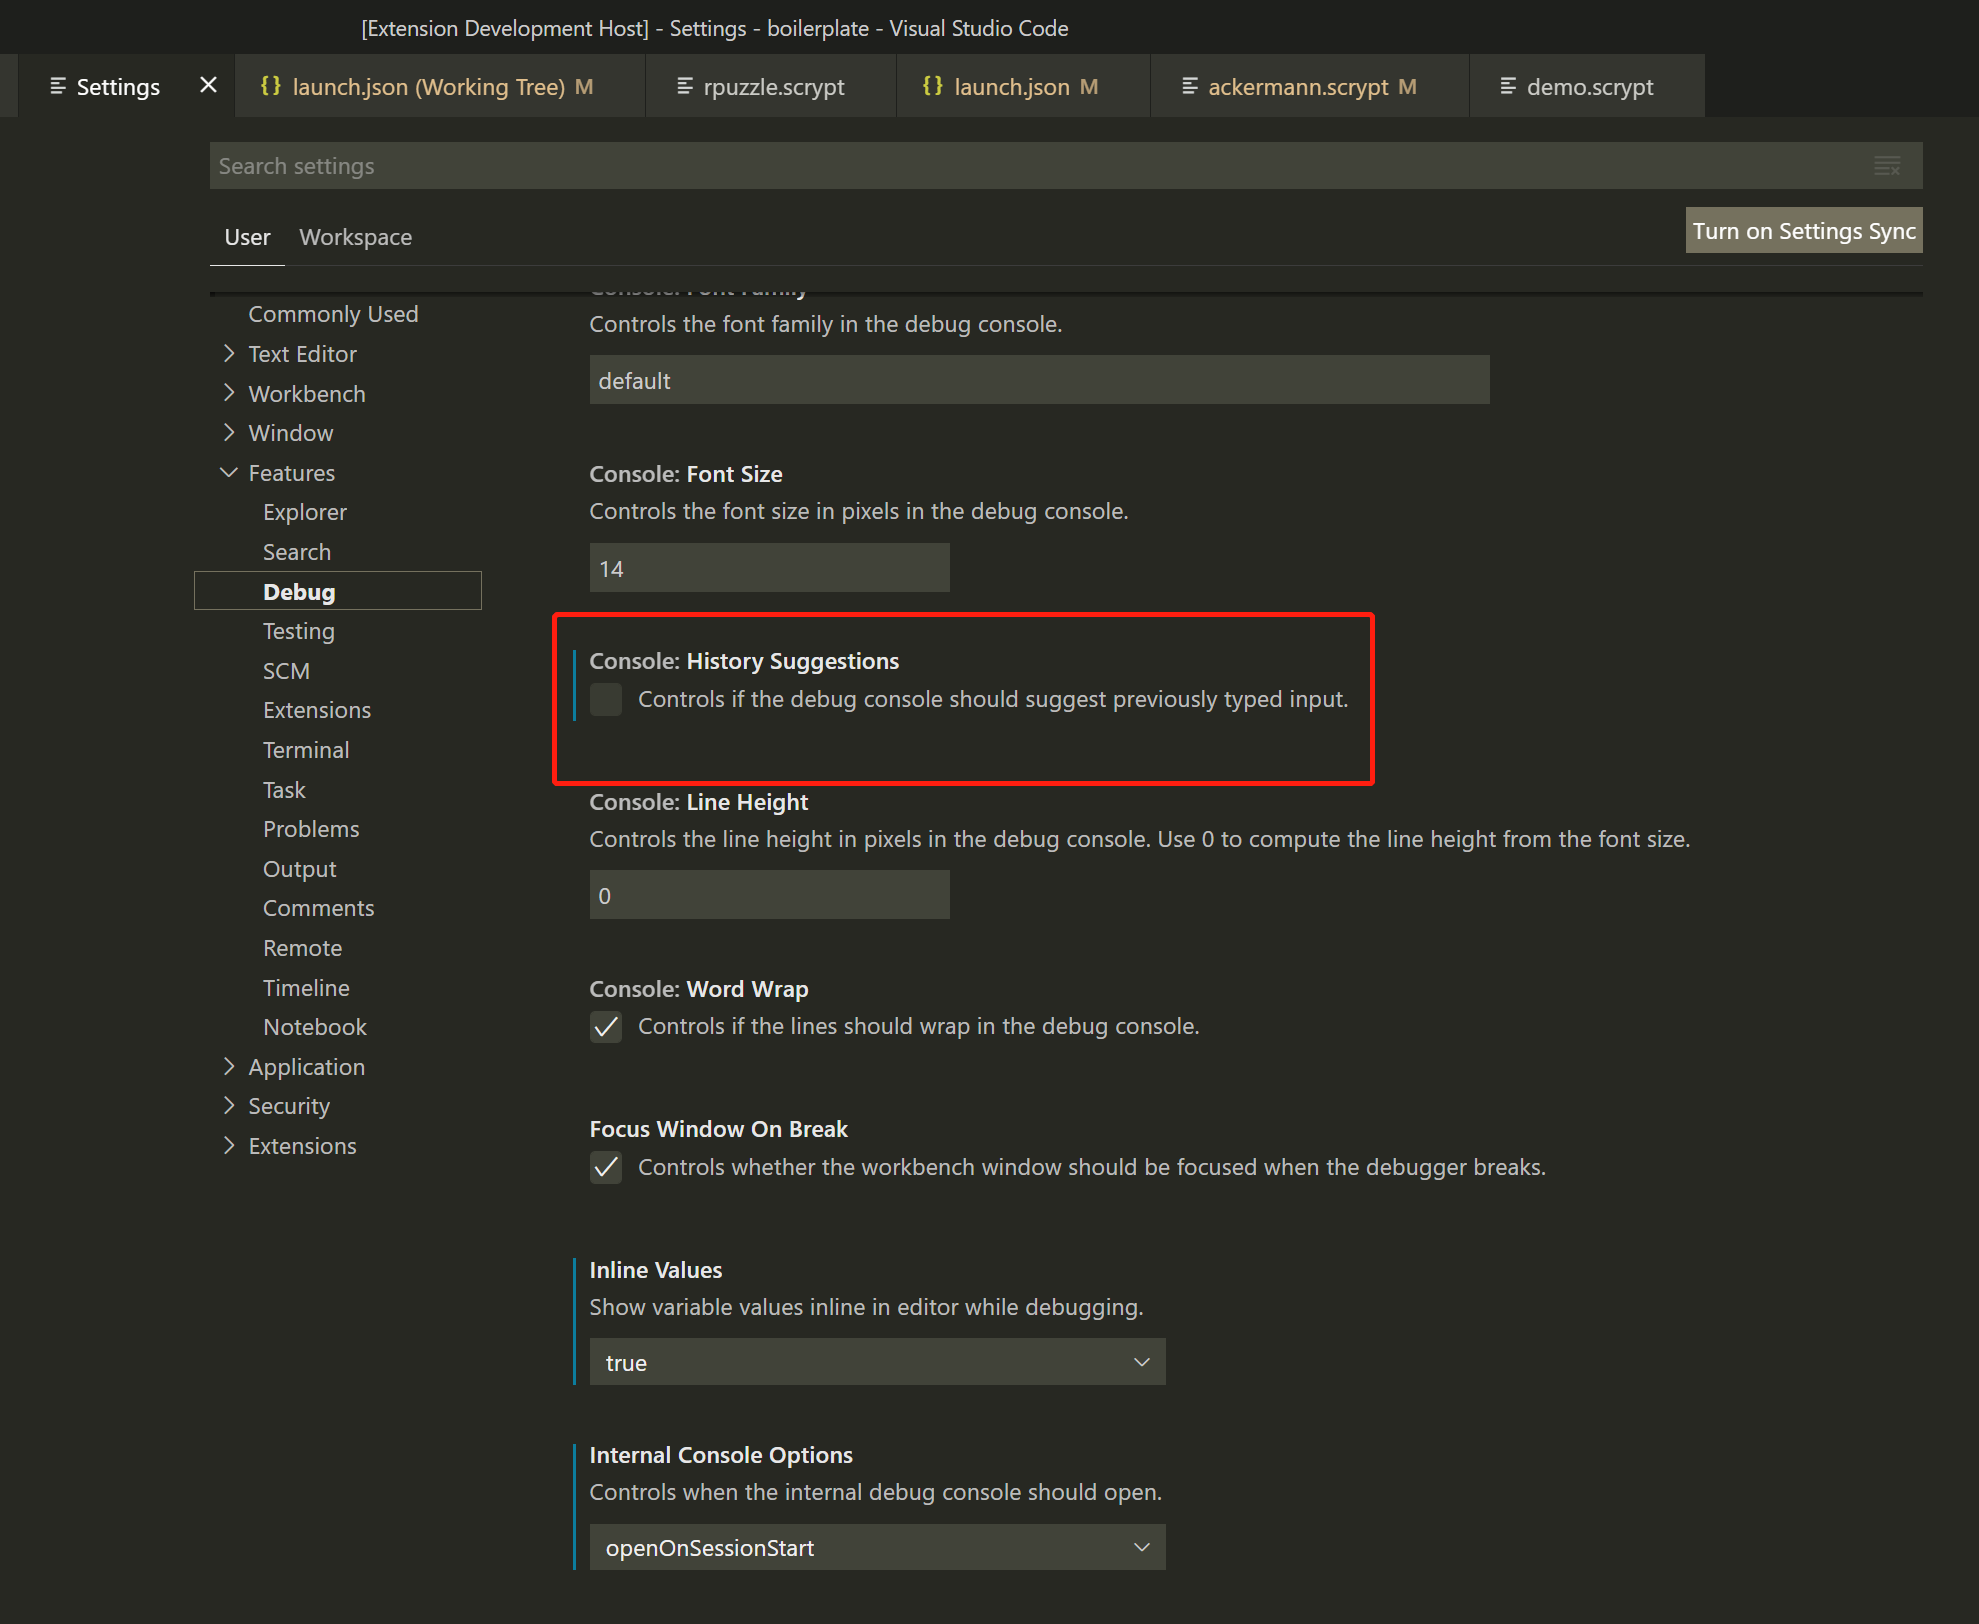
History Suggestions
History function requires corresponding settings to be turned on. If it is not enabled, find Settings->Features->Debug->Console->History Suggestions and enable it.
Built-in Commands
All built-in commands start with :
command |
Features |
|---|---|
:hex2Asm |
Convert |
:parsePreimage |
Convert the pre-image of type |
:diffoutputs |
Compare the specified |