Debugger
IDE comes with a powerful debugger. You can use it to debug the .scrypt source code. If you have purchased advanced paid features, you can also use it for script-level debugging. Not all contracts can be written and behave as expected. When an error occurs, you may need to stare at the code for several hours. A good debugger can make it easier and more efficient for you to solve the problem. When debugging a contract, the debugger provides many methods for you to view the status of the code, such as step-by-step execution of the code, view the value stored in the variable, view the call stack of the function, view the data in the Bitcoin dual stack, and the execution path of the code.
Configure Startup Parameters
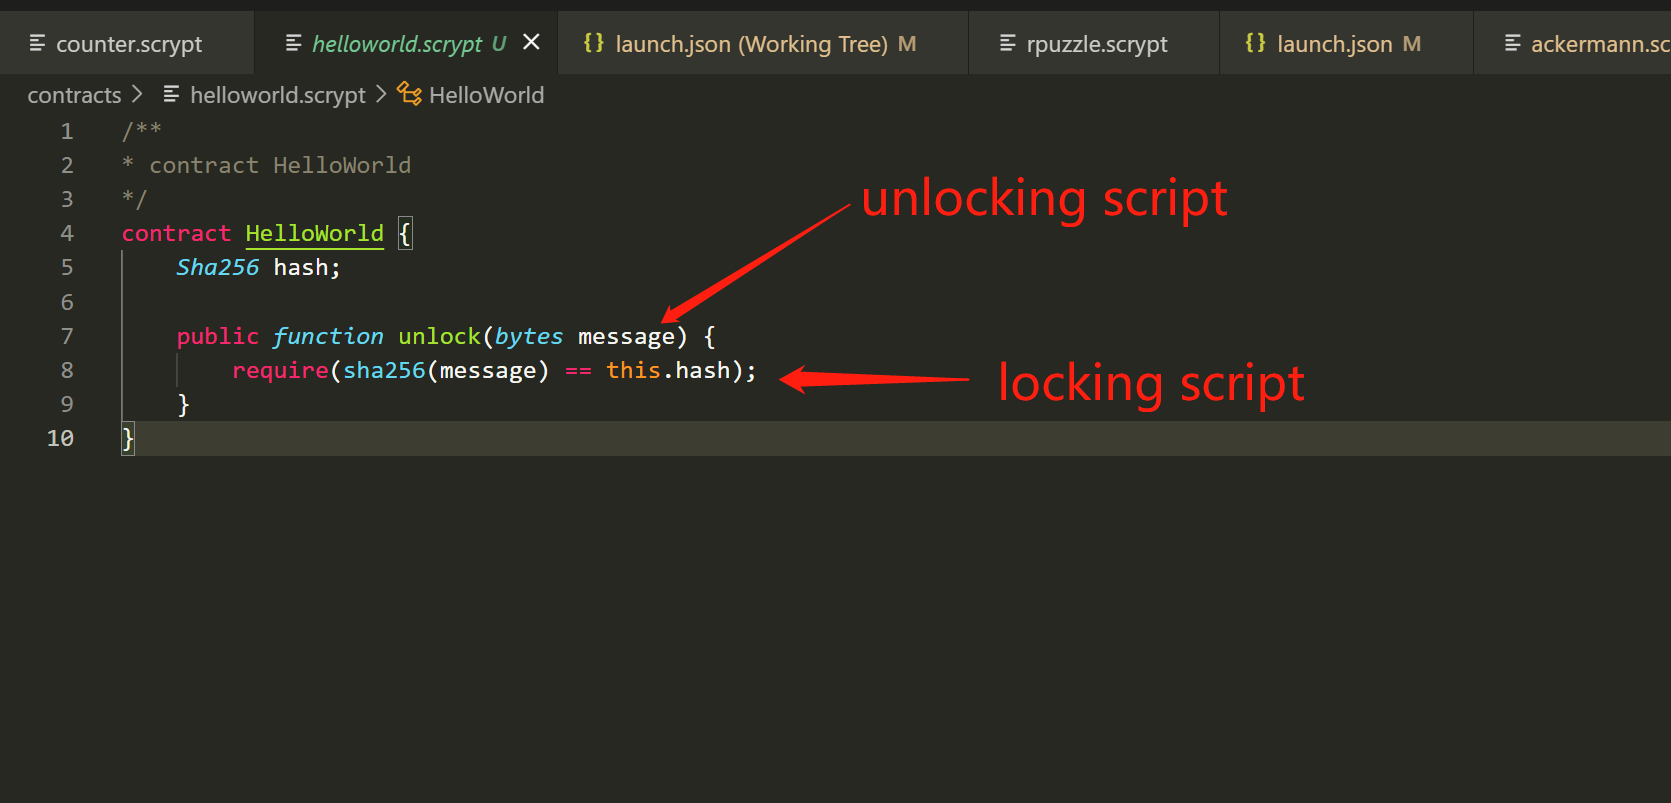
Unlike general languages (such as C++/Javascript), the debugger that starts IDE must be configured with startup parameters. This is determined by the structural characteristics of the sCrypt language, as shown in the following figure: We know that the execution of the Bitcoin script is to connect the unlocking script and the locking script to form a complete script before execution, where the unlocking script is first, and the locking script is Rear. The sCrypt contract contains one or more public functions. Starting the debugger is to run a certain public function of the contract. The parameters of the function correspond to the unlock script, and the content of the function corresponds to the lock script. To run this function, you need to correctly configure the parameters of the calling function according to the signature of this function, that is, the unlocking script.
Create launch.json
Open the debug view. If the launch.json is not created in the current workspace, you will be prompted to create a new launch.json file.
The following is an example configuration for debugging the p2pkh contract:
 1{
 2    "type": "scrypt",
 3    "request": "launch",
 4    "name": "Debug P2PKH",
 5    "program": "${workspaceFolder}/contracts/p2pkh.scrypt",
 6    "constructorArgs": [
 7        "Ripemd160(b'40933785f6695815a7e1afb59aff20226bbb5bd4')"
 8    ],
 9    "pubFunc": "unlock",
10    "pubFuncArgs": [
11        "Sig(b'304402205b131a25e067bd9d692e2e5b5ccef30f74a1c0dfb3dd19f97e8cd65871ec703f0220323e5747dccb2a8698ab02b61b6a39867b57b824c8569a6398fe2d8a2cd4ab3f41')",
12        "PubKey(b'03f4a8ec3e44903ea28c00113b351af3baeec5662e5e2453c19188fbcad00fb1cf')"
13    ],
14    "txContext": {
15        "hex": "01000000015884e5db9de218238671572340b207ee85b628074e7e467096c267266baf77a40000000000ffffffff0000000000",
16        "inputIndex": 0,
17        "inputSatoshis": 100000
18    }
19}
Configuration Description
Configuration |
Required |
Description |
|---|---|---|
type |
Yes |
Configuration type, fixed as |
request |
Yes |
Debugger startup type, only supports |
name |
Yes |
Configuration name |
program |
Yes |
To debug the source code file, you can use the VS Code workspace folder |
constructorArgs |
Yes |
Contract constructor parameters |
pubFunc |
Yes |
public function name to be debugged |
pubFuncArgs |
Yes |
The arguments of the public function to be debugged |
txContext |
No |
Required to debug a function that needs Transaction Context |
asmArgs |
No |
Argument Input Format
Parameter Type |
Input Format Description |
|---|---|
bool |
|
int |
Number or string, if the value is less than |
bytes |
A string, for example: |
PubKey |
String, e.g., |
PrivKey |
String, e.g., |
Sig |
String, e.g., |
Ripemd160 |
String, e.g., |
Sha1 |
String, e.g., |
Sha256 |
String, e.g., |
SigHashType |
String, e.g., |
SigHashPreimage |
String, e.g., |
OpCodeType |
String, e.g., |
Array |
Same as JSON array, all elements must be of the above basic types or structures or arrays |
Structure |
Same as JSON objects, all members must be of the above basic types or structures or arrays |
Type Alias |
Use the actual type corresponding to the type alias as the input format, for example: |
Transaction Context
The transaction context, the txContext parameter, specifies the relevant context information of the current transaction during debugging. It is only needed when verifying signature or tx preimage in the contract. Missing it will cause the debugger to fail to verify.
Field |
Required |
Description |
|---|---|---|
hex |
Yes |
The serialized current transaction, that is, the transaction where the unlock script is located. It can be signed or unsigned |
inputIndex |
Yes |
The input index corresponding to the UTXO to be spent and locked by the contract |
inputSatoshis |
Yes |
The amount of Bitcoin in UTXO to be spent and locked by the contract, in satoshis |
opReturn |
No |
The state of a stateful contract, starting from OP_RETURN, excluding OP_RETURN, in asm format |
opReturnHex |
No |
The state of a stateful contract, starting from OP_RETURN, excluding OP_RETURN, in hex format |
Hint
Understand how the verification signature works: CHECKSIG
Launch the debugger
There are 4 ways to start the debugger:
1. Start by F5
To start with F5, you need to create launch.json and configure the startup parameters. You can also start the debugger through the debug button in the debug view. This is also the most common way to start other debuggers.
2. Start by Testing
3. Start by Launch Debugger command
4. Start by Launch Debugger from TxContext command
The Launch Debugger from TxContext command will open a debugger startup view. It allows you to debug a contract by entering the txid of the transaction or the whole transaction in raw hex. You can choose to debug the transaction on the mainnet or testnet, and which input to debug the transaction. You can also choose to automatically generate the contract source code in Script or attach an existing sCrypt contract. The automatically generated contract source code only contains Inline Assembly. If the attached sCrypt contract mismatches with what is on chain, the Script code will be automatically generated.
Hint
Video introduction: 4 ways to start the debugger
Set breakpoint
Before starting the debugger, first set a breakpoint. Breakpoint is a basic and important function for debugging. If the file is opened in the code editor, you can set the breakpoint by clicking the margin, or press F9. Then press F5 or click the “Start Debugging” button in the Run and Debug sidebar panel, and the debugger will run to the first breakpoint it hits.
Step Over
After the debugger hits a breakpoint, it enters the debug mode. Contract execution is suspended. Functions, variables, and contract instances remain on the stack. Next:
Start stepping through the code by pressing F10 or F11
Open the right-click menu and select Run to Cursor menu
Execute to the next breakpoint by pressing F5
By pressing Shit + F11 to stop single step execution, jump out of the current function
When browsing the code in the above operations, the data in the Variable Panel and Call Stack Panel in the debugging view on the left will change in real time. If you add an expression or variable to the Watch Panel, it will change in real time too.
Note
Only one public function can be used as the entry point for debugging at a time.
Debug Actions
After the debugging session starts, the debugging toolbar will appear at the top of the code editor.

Continue/Pause F5
Step Over F10
Step Into F11
Step Out Shift+F11
Restart Ctrl+Shift+F5
Stop Shift+F5
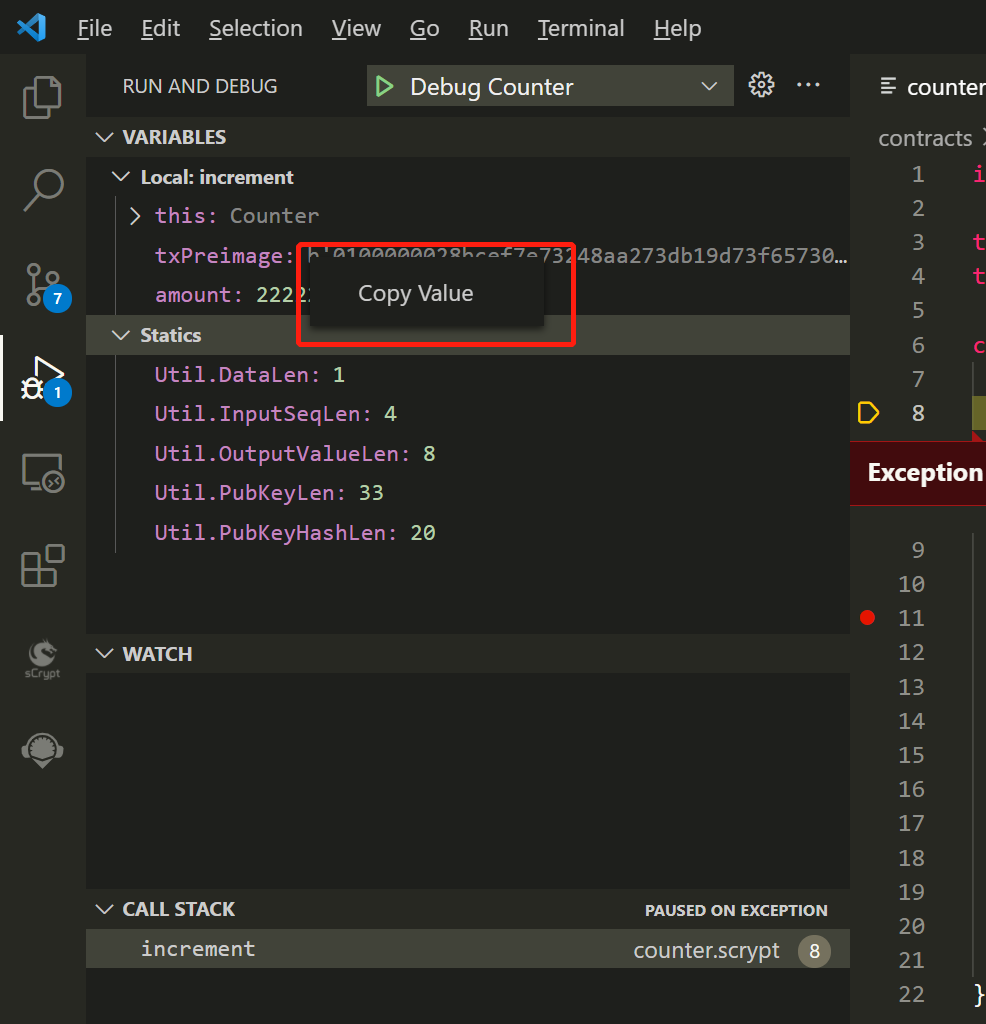
Variable
Variable Panel mainly displays variables in two scopes: current function and static variables. this represents the current contract. Click to expand to view all the properties of the contract. Under Statics, all static variables are displayed.
Copy Value
Right-click on a variable, the Copy Value menu will appear, you can directly copy the value of the variable to the clipboard.
Note
Static variables that are not referenced will not appear in the final script compilation output, nor will they be displayed in the panel.
Switch display format
Right-click on a variable, and the Toggle showing bytes in hex or utf8 string and Toggle showing int in hex or decimal menus will appear. Click the menu to switch the display format of the variable value.
Note
Change the display format of a variable, and the display format of other variables of the same type will also change.
Watch
You can add variables and expressions in the Monitor Panel.
Call Stack
Use the “Call Stack” panel to view all functions currently being called. The “Call Stack” window shows the order in which the functions are called. The bottom of the stack is the public function currently being debugged. Click the function name on the “Call stack” and the code editor will automatically jump to the location of the function definition.